In 1936, the Literary Digest conducted what was then one of the largest and most expensive polls of all time. With a sample size of nearly 2.4 million people sourced from subscription lists, telephone directories, and club rosters, the esteemed magazine predicted that Alfred Landon, the Republican governor of Kansas, would win the presidential election by a 14-point margin over the incumbent Franklin Roosevelt. “When the last figure has been totted and checked,” the Digest’s editors wrote in August of that year, “the country will know to within a fraction of 1 percent the actual popular vote of forty million [people].”
Three months later, however, they proved to be dead wrong. Roosevelt won the popular vote by more than 24 points in what is now remembered as one of the greatest political landslides on record. The Literary Digest poll has since gone down in history as a cautionary tale of sampling bias pitfalls, and is taught in intro-level statistics classes. Even the infamous 1948 election polls, known as the “Dewey Defeats Truman” disaster, did not fail quite so horribly as the Literary Digest in 1936.
Eighty years later, the polling industry was well overdue for a crash and burn of equal scale. In his final projections before the presidential election, the Princeton Election Consortium’s Sam Wang gave Hillary Clinton a whopping 99 percent probability of winning. The New York Times, meanwhile, put her at 85 percent. Of the ten major polls averaged by RealClearPolitics, eight predicted she would win by a margin of at least three points. Not even the respective campaigns’ internal polls foresaw a Donald Trump victory, which only became clear at around 8:30 p.m. on November 8. “We all estimated the Clinton win at being probable, but I was most extreme,” admitted Wang, who fulfilled his promise to eat a bug on live television after Trump won. “Polls failed, and I amplified that failure.”
Even the political betting markets—once hailed by economists as the new frontier of predictions for integrating all available polling data, analysis, and other information—were blindsided. They were supposed to play the long game: While the polls were a snapshot of what people were thinking in a particular moment, the markets were more focused on what would happen in the future.
But the markets had two major failures this year: first, Brexit and then Trump. In the days before the British referendum to leave the European Union, PredictIt reported that shares were only trading at 27 cents on the probability of an exit. And at 8:13 p.m. on election night, Clinton’s stock saw an all-time high of 94 cents. That fell to below 50 cents by 9:50 p.m. and to a penny by 1:44 a.m. the following morning.
What went wrong? Political scientists say that one of the major flaws of polling in 2016 was a failure to account for correlated error—the idea that, if Clinton underperformed expectations and lost in, for example, Wisconsin, she might also lose in Ohio, Pennsylvania, Michigan, and so forth.
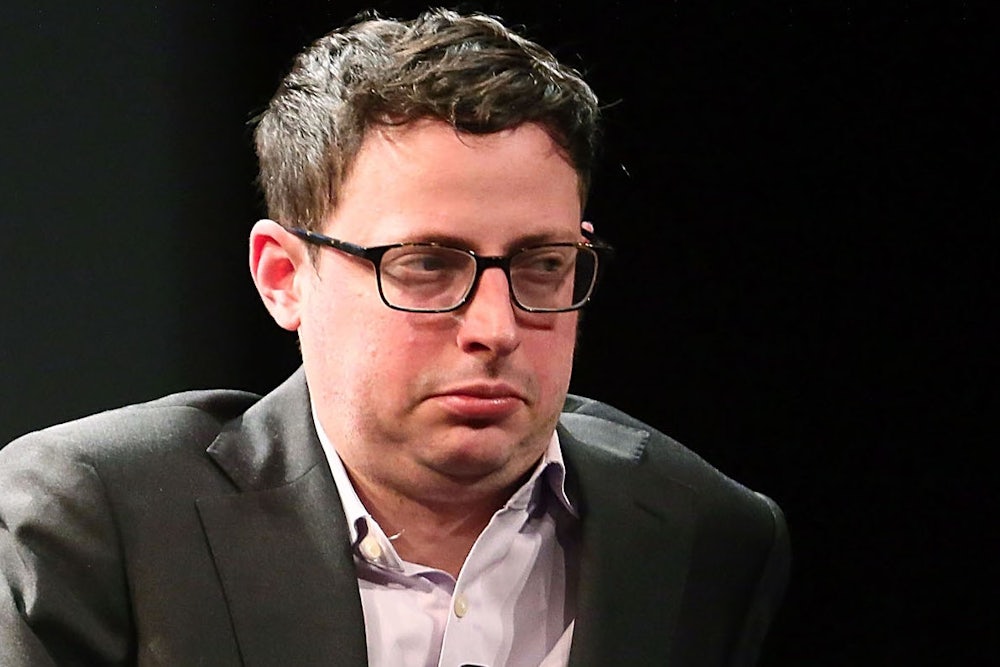
FiveThirtyEight’s Nate Silver, who successfully predicted the 2008 and 2012 presidential races, was among the few pollsters to at least account for correlated error, giving Trump a 28 percent chance of winning. Prior to the election, Silver was maligned for being too generous to Trump—The Huffington Post’s Washington bureau chief went so far as to call him a “mockery” for “monkeying around” with the numbers (he later apologized). “Nate Silver was the most responsible in trying to gauge the uncertainty,” said Eitan Hersh, a Yale political science professor who specializes in election systems. For his part, Wang admitted that he miscalculated correlated error.
Many pollsters also employed an error-prone workaround for low response rates. In most random samples of 2,000, the response rate is almost always under 10 percent. To compensate, a statistician assumes that an individual is representative of their demographic and “weights” his or her response. “We’re better off than we were in 1936 because we’re not assuming that one observation is representative of the whole population,” said Michael Bailey, a Georgetown University government professor, “but we’re no better off in the sense that we’re assuming that, based on things we know about a respondent, that person is representative of all the other Americans who have those characteristics.”
That assumption certainly didn’t hold true in the case of Trump’s base. Silver claims that, as a result of weighting, pollsters probably did not talk to enough white voters without college degrees. In part, that may be because Trump voters are less likely to respond to a political poll. Bailey is currently testing to see whether his respondents’ willingness to respond had a result on the content of his poll—if so, polling conventions are skewed.
There is no easy fix for a response bias that seemingly is incapable of picking up Trump’s base. But some political scientists say that panel surveys—which poll the same voters over time, rather than taking a random sample—were able to register the Trump effect more accurately. Panel surveys offer pollsters a better understanding of changes in voting intentions and behavior.
The Los Angeles Times/University of Southern California poll, though widely viewed as one of the most incorrect polls of 2016, used a panel survey and was able to identify voters who were newly active in politics this election cycle—a hint that the makeup of the electorate had shifted, upending some of pollsters’ baseline assumptions. “The poll over-weighted people who sat out the 2012 election and said that they would participate this year,” David Lauter, the Washington bureau chief of The Los Angeles Times, told me. “That was a group which favored Trump, and it appears to be the group that was key to his stronger-than-expected performance in several key states. The poll over-estimated the amount that those voters would contribute to the national margin, but it correctly identified them as key to Trump’s chance of winning.”
In the end, no model would have offered any certainty about the outcome of the election. Hersh, the Yale professor, said that campaigns, the media, and the public might do well to turn to qualitative measures of enthusiasm to deepen their understanding of the electorate. “Hillary Clinton was never going to be able to generate the same kind of base activist enthusiasm as Obama or even as Bernie Sanders,” he said. “You drove out to the suburbs and saw Trump signs everywhere. Trump was derided for talking about the crowd size, but it might be a decent indicator of enthusiasm.”
America’s divisions were in plain sight. But pollsters and political analysts alike portrayed Hillary Clinton’s victory as an inevitability, failing to realize the precariousness of their own models’ assumptions and to communicate any sense of uncertainty. “The problem was that, in the end, we (myself included) acted as if a coin-toss election were much more certain than it was,” The Los Angeles Times’s Lauter said. “The lesson people should take away from that is humility in making predictions.”
